See the campaign trend, not just a lifetime total
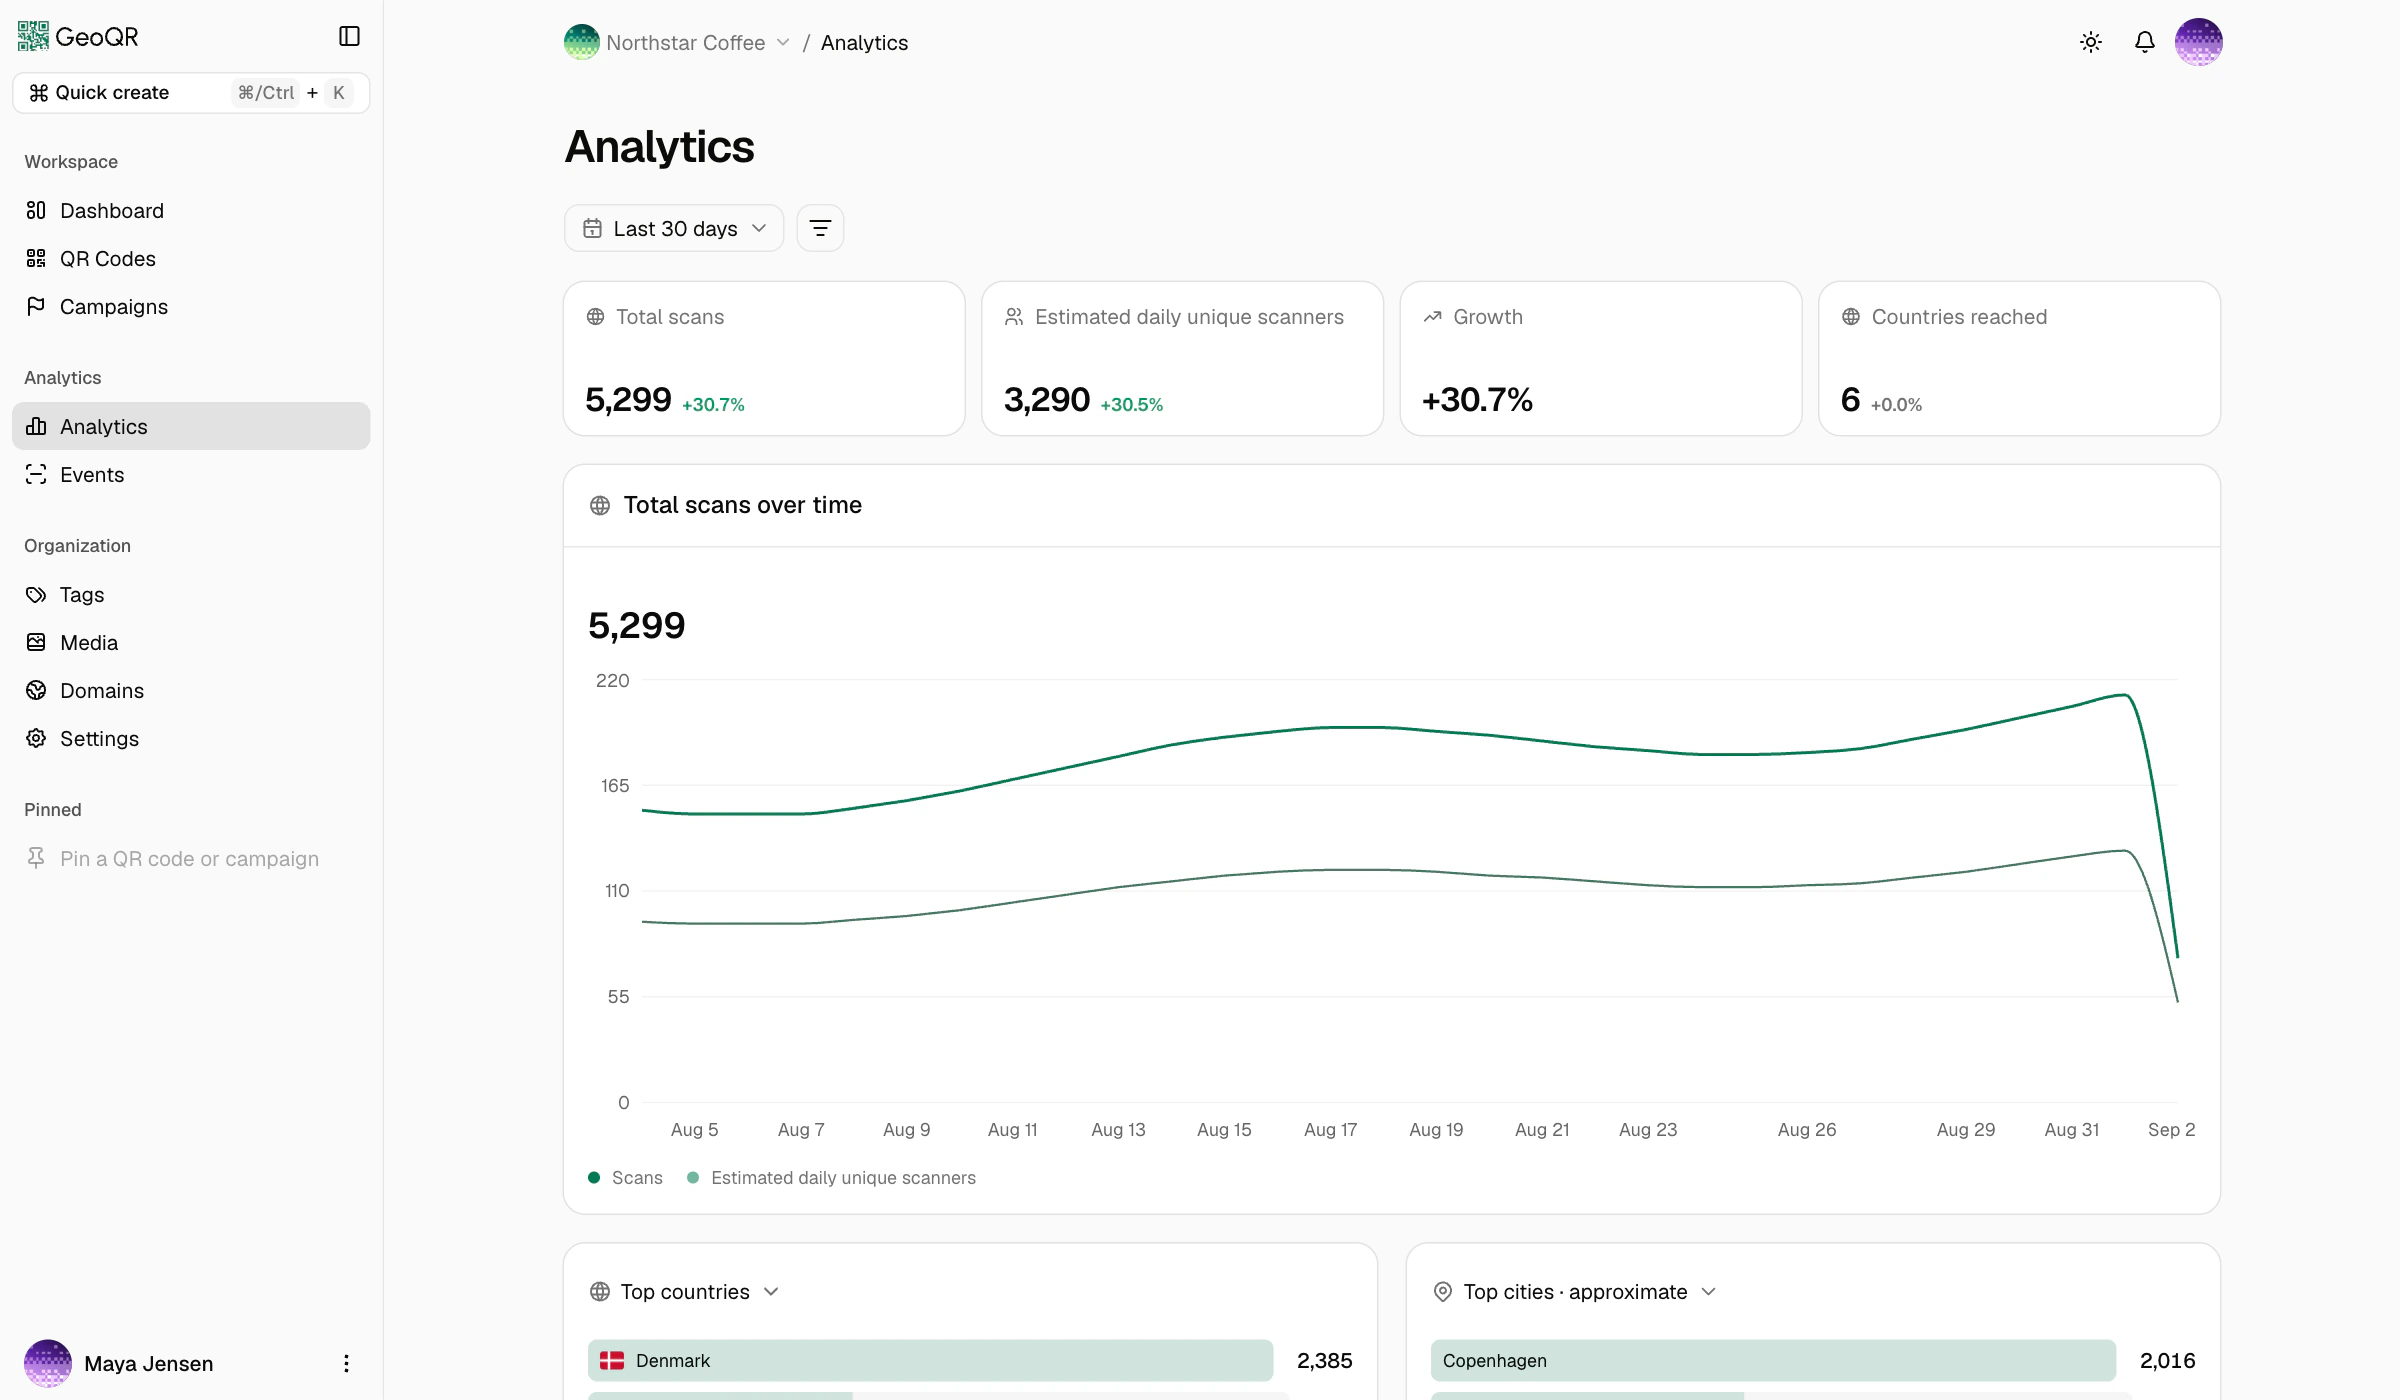
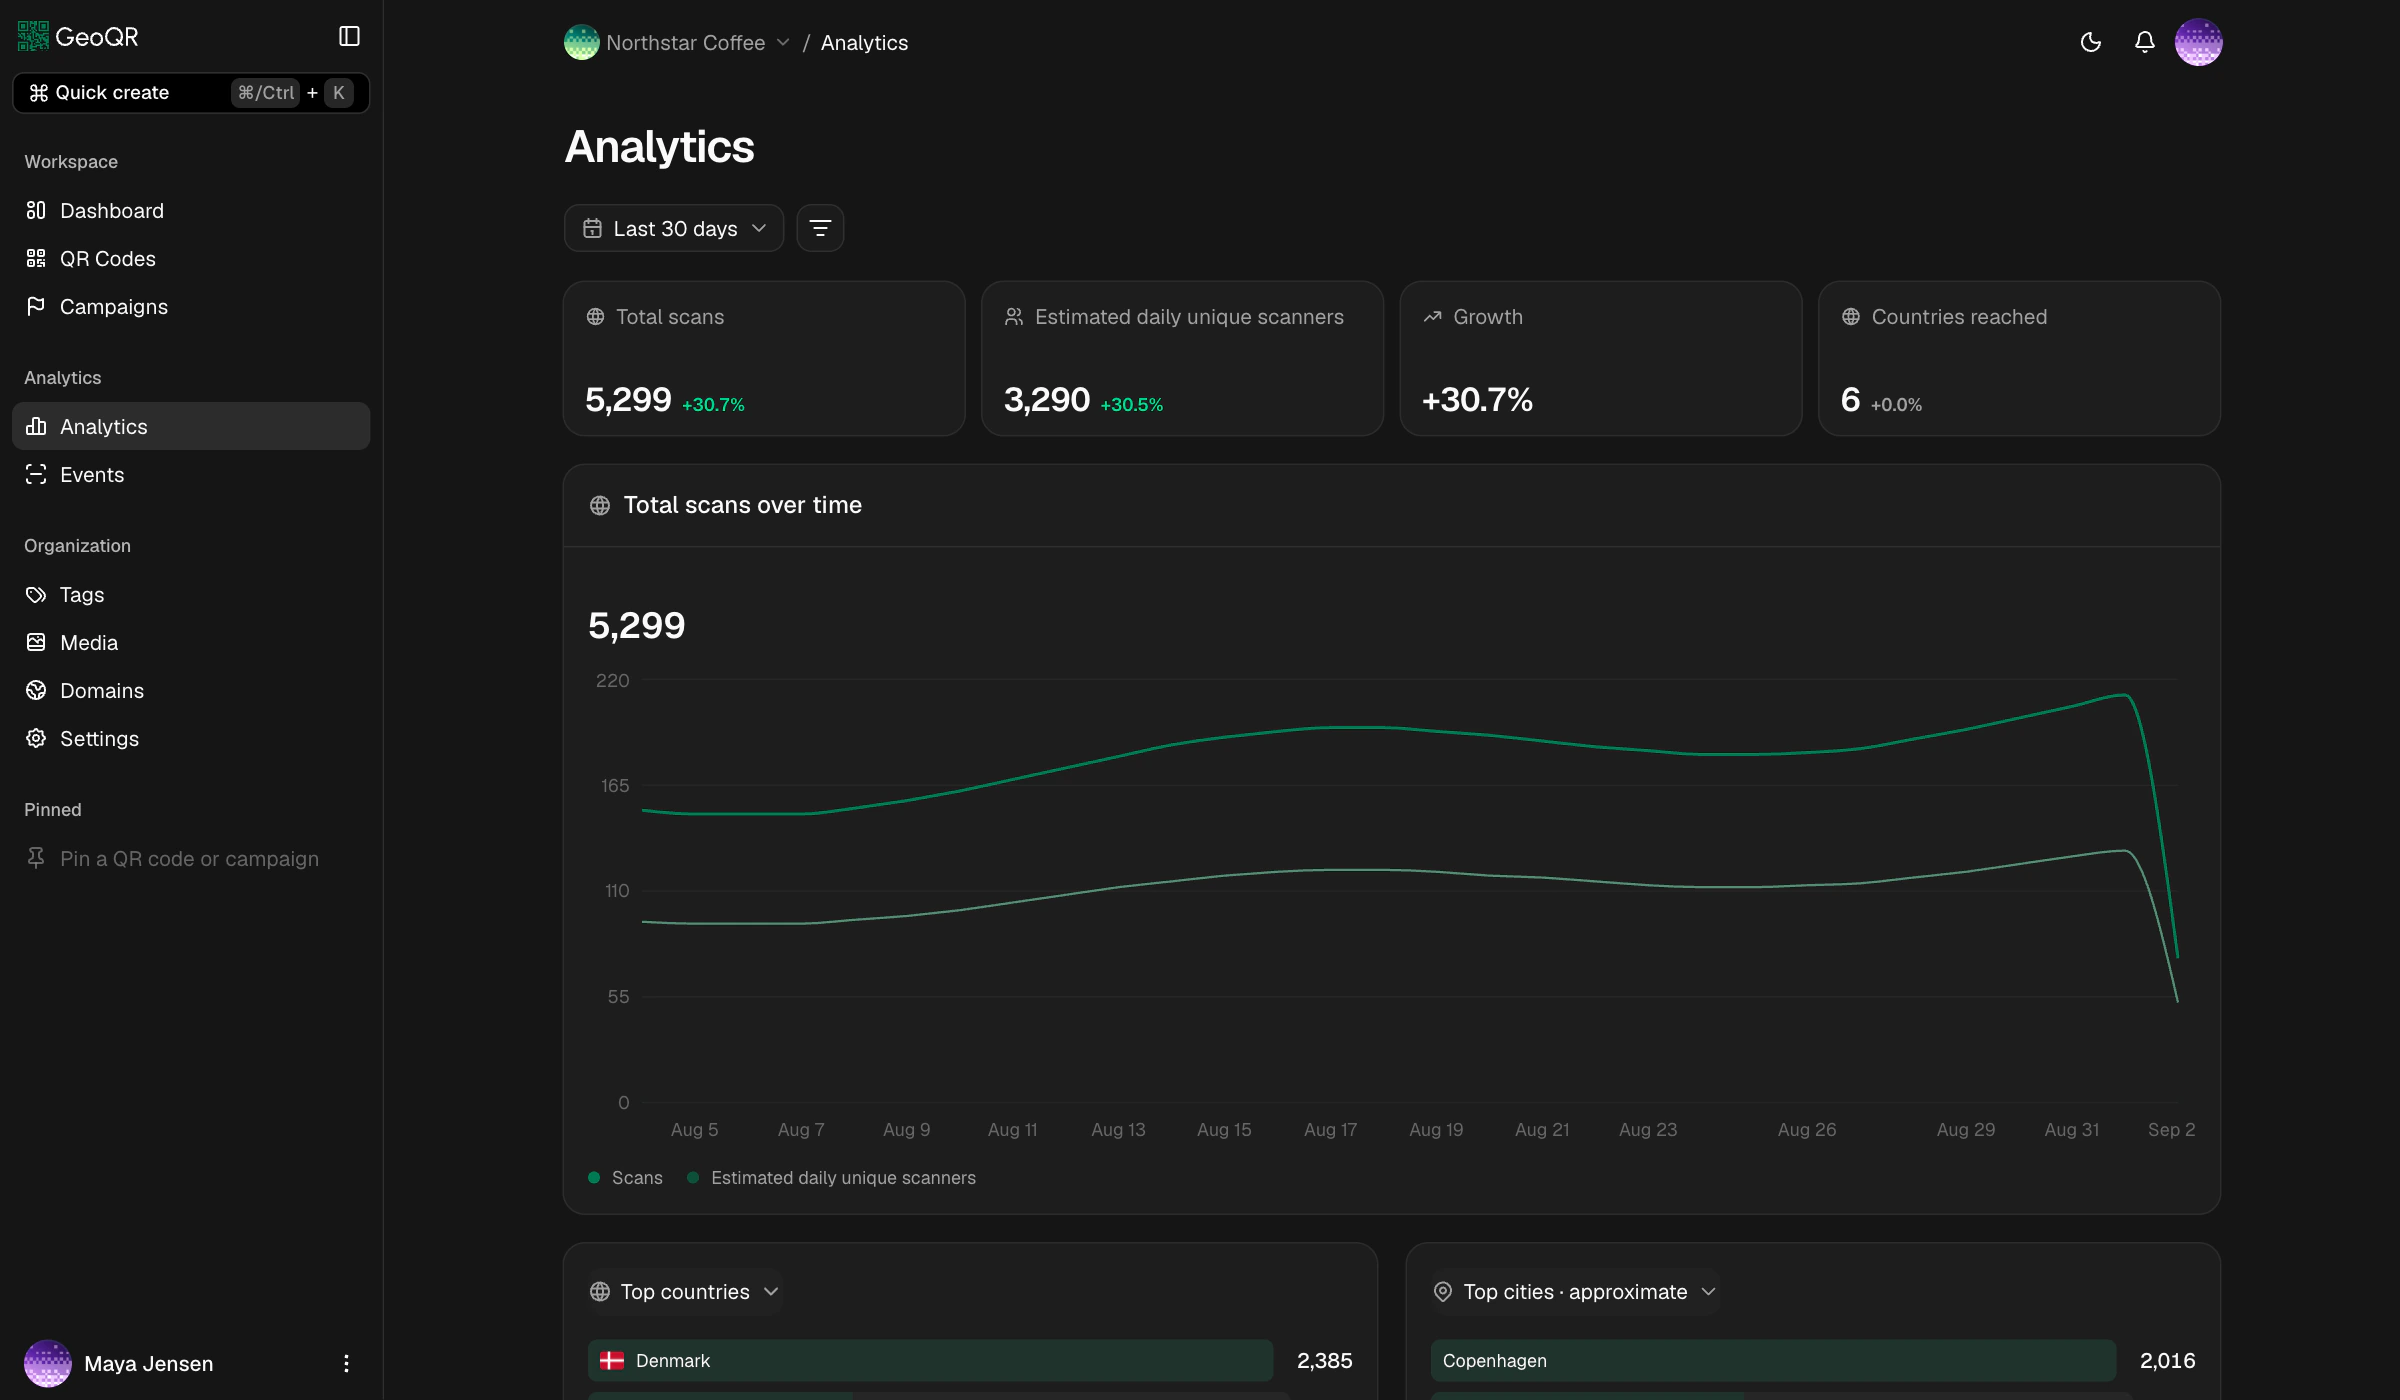
See total scans, estimated daily unique scanners, growth, and countries reached for the selected period. Compare the result with the preceding period and follow the trend over time.
QR analytics / Campaign performance / Scan activity
See how often your dynamic QR codes are scanned, when activity peaks, and which countries, devices, and destinations appear in your reports. Compare campaigns with scan totals, estimated daily unique scanners, and individual scan events.
From overview to individual events
Use separate QR codes for a poster and a package, then compare their scans over the same period. Filter by campaign, country, or device and inspect individual events to understand which destinations people reached.
Scan activity is different from website visits or purchases. Use campaign UTM tracking with analytics on your destination website to follow what happens after the redirect. Follow our guide to tracking QR code scans and comparing campaigns for the setup steps.
See total scans, estimated daily unique scanners, growth, and countries reached for the selected period. Compare the result with the preceding period and follow the trend over time.
Compare campaigns, QR codes, countries, regions, cities, devices, browsers, operating systems, referring websites, and destinations. Change the breakdown without rebuilding the report.
Filter the entire report by campaign, tag, QR code, location, device, browser, referrer, destination, routing outcome, or client category. Layer filters together to isolate one audience, placement, or result without rebuilding the report.
Open Events when you need the details behind the charts. Review individual scan times, QR codes, approximate locations, device context, referring websites, and resolved destinations.
Focus the report on one campaign, a set of tags, or specific QR codes to answer a narrower question.
Compare approximate geography, device type, browser, and operating system to understand the context around scans.
See which page opened, where available traffic came from, and which routing rule selected the destination.
Review the history included with your plan. GeoQR shows when a requested range has been limited to the available retention period.
How QR analytics works
GeoQR organizes retained scan activity around the code, campaign, route, destination, approximate context, and time of each request.
Read the analytics guideA request reaches a published GeoQR code and the configured routing selects a destination.
GeoQR records the server-observed activity and separates recognized automated traffic from the main totals.
The overview turns retained scan activity into totals, comparison periods, trends, breakdowns, and a time heatmap.
Apply filters or open Events when you need to investigate a campaign, placement, audience context, or destination more closely.
Questions
The practical details behind scan totals, estimated daily unique scanners, approximate location, filters, retained history, and individual events.
GeoQR reports server-observed activity for published QR codes after recognized automated traffic has been filtered from the main totals. A scan count does not prove that every request came from a distinct person or a physical phone-camera scan.
Estimated daily unique scanners is a privacy-friendly estimate of different scanners active on each day. It is not an exact count of people, it resets daily, and shared devices, privacy tools, or network changes can affect the result.
No. Country, region, and city values are approximate and can be unavailable. VPNs, proxies, mobile carriers, and corporate networks can affect the apparent location. GeoQR does not present analytics as precise GPS tracking.
You can filter by campaign, tag, QR code, country, region, city, device, browser, operating system, referring website, destination, routing outcome, and client category. Filters can be combined to focus on a specific part of a rollout.
Analytics history depends on the plan. Free includes 30 days, Starter includes one year, Growth includes three years, and Scale includes five years. When a requested range exceeds the available history, GeoQR adjusts it to the oldest available date and shows a notice.
Events shows the individual scan activity behind the totals and charts, including time, QR code, approximate location, device context, referring website when available, and the resolved destination. GeoQR does not store raw IP addresses or complete browser identification strings for these reports.
Start with one live QR code
Publish a QR code, let real scan activity arrive, and use the overview, filters, breakdowns, and events to understand what happens next.
Free plan · No credit card required